Publication-quality Stata output, without writing or debugging commands.
You type the request. Noolio writes the commands and runs them.
Requires Stata 17+, licensed on your machine. Free download.
Built by researchers from
The cleaning takes longer than the analysis. Start there.
Preparing a messy dataset often takes longer than the econometrics. You know how the data needs to be structured. Tell Noolio what you want - to clean the string variables, or parse the dates, or reshape to long, and it writes and tests the Stata syntax on your machine until the data is ready.
gen dollar_amt = .
replace dollar_amt = real(regexs(1)) if regexm(contract_notes, "\$([0-9,]+\.?[0-9]*)")
label variable dollar_amt "Dollar amount extracted from contract_notes"
Charts and tables, ready for the paper.
You describe the chart: "scatter plot of income vs. education, colored by region." Noolio runs the Stata graph command on your machine and opens the figure in a separate window.
Tables come out the way you need them for the paper. Coefficients, standard errors, significance stars, R-squared, formatted and ready to read. Export to .tex and drop it into your draft.
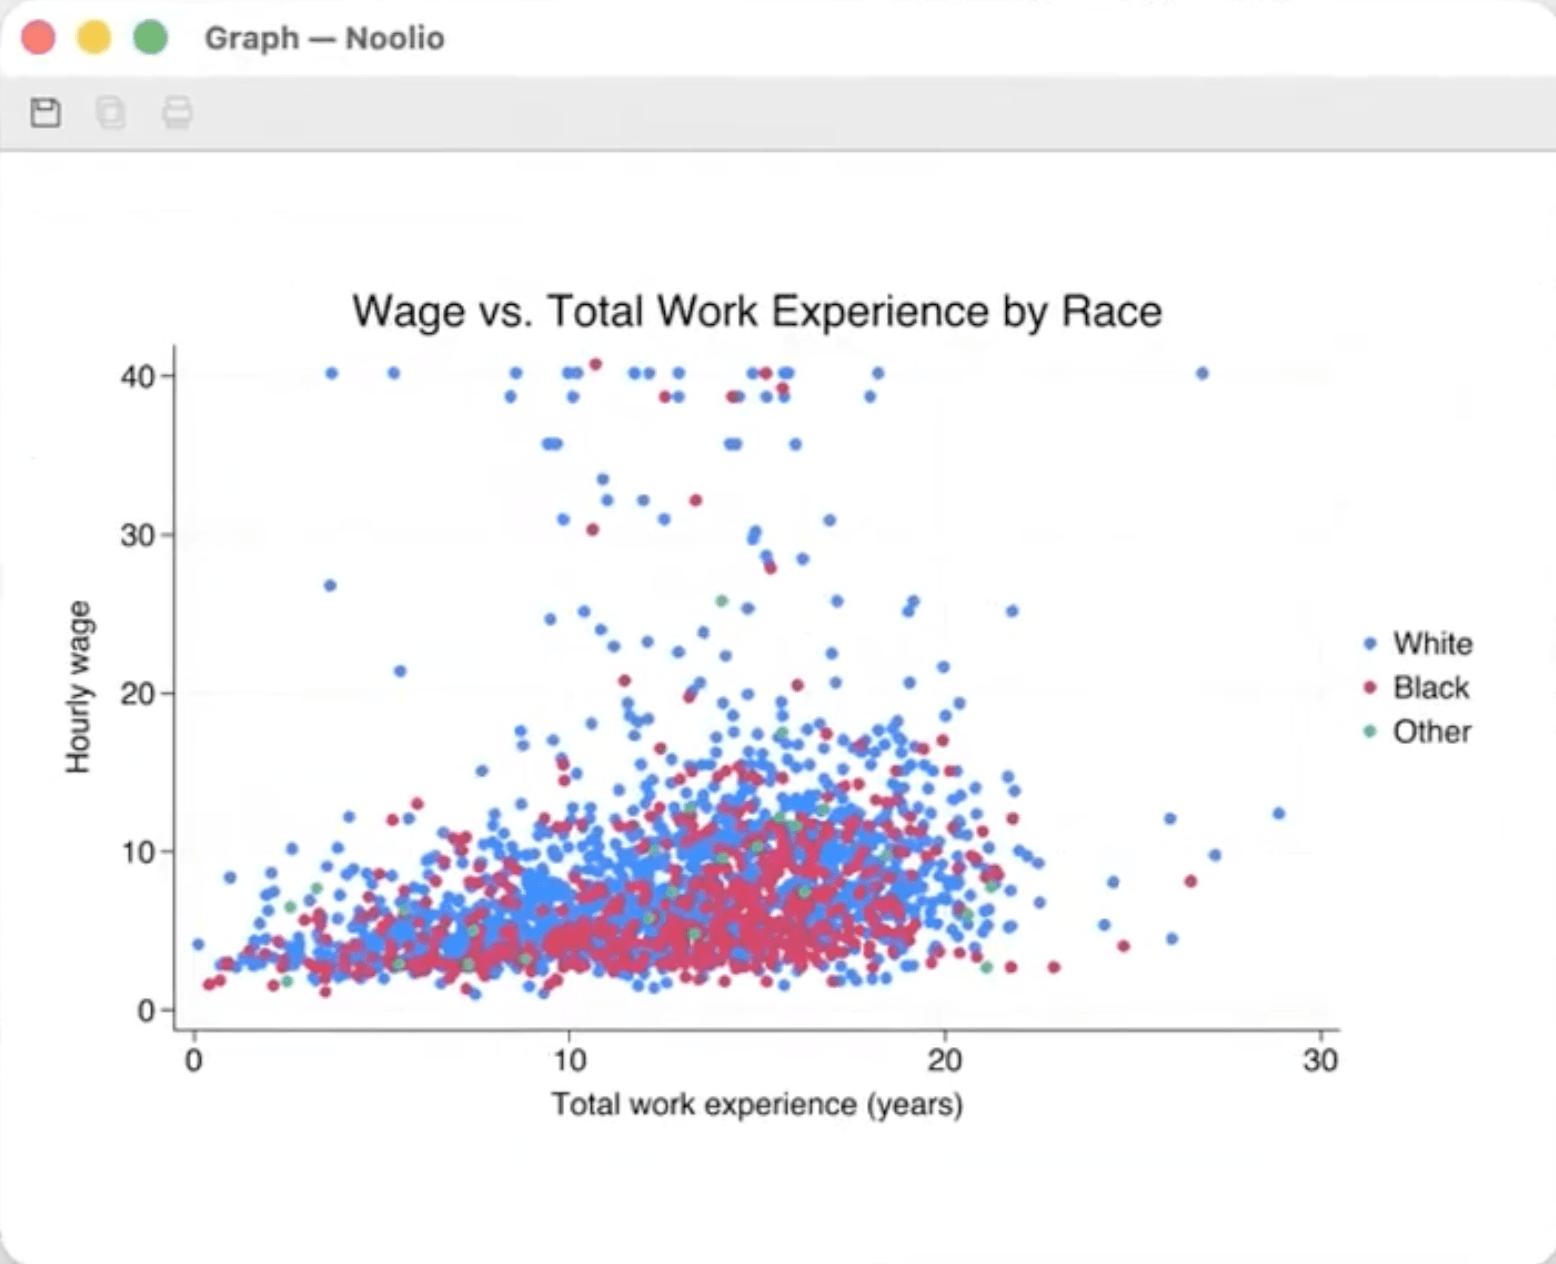
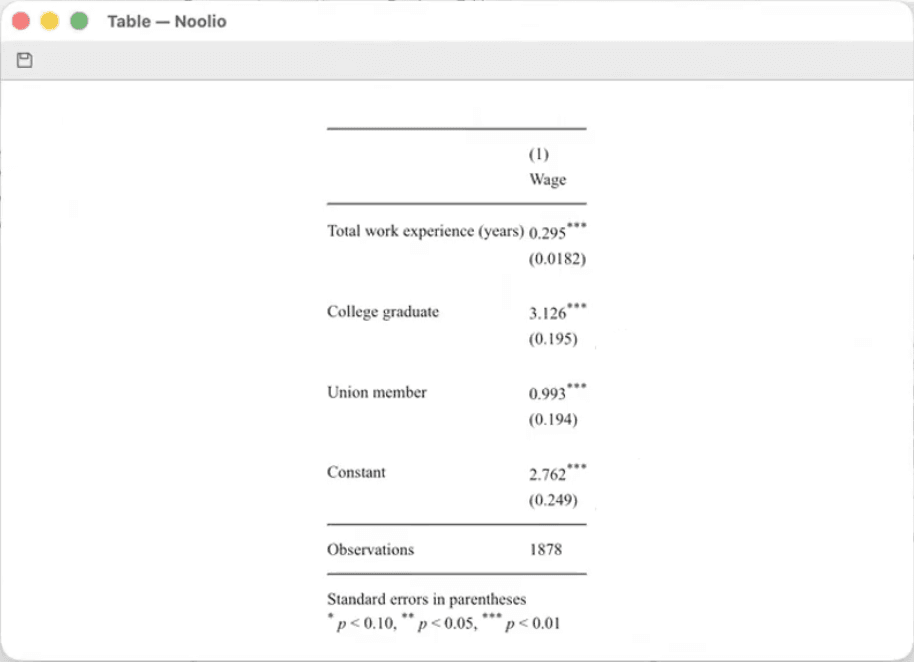
An agent that runs your analysis, not a chatbot that suggests code.
What you do now
- Run the command
- Read the error
- Fix a variable name
- Run it again
- Check the output
- Notice the labels overlap
- Adjust, rerun
What you do with Noolio
- Type the request
- Use the output
› regress wage educ exper tenure, robust
variable educ not found
rewriting command...
› regress wage education experience tenure, vce(robust)
✓ 2,246 observations
The half hour you'd spend on syntax goes back into the analysis.
What you need.
- Stata 17 or newer, installed and licensed on your machine.
- python3. If Noolio asks for it on first launch, download it free from python.org.
Frequently asked questions.
No, but you need Stata installed.
Got more questions? Write to us at info@noolioapp.com